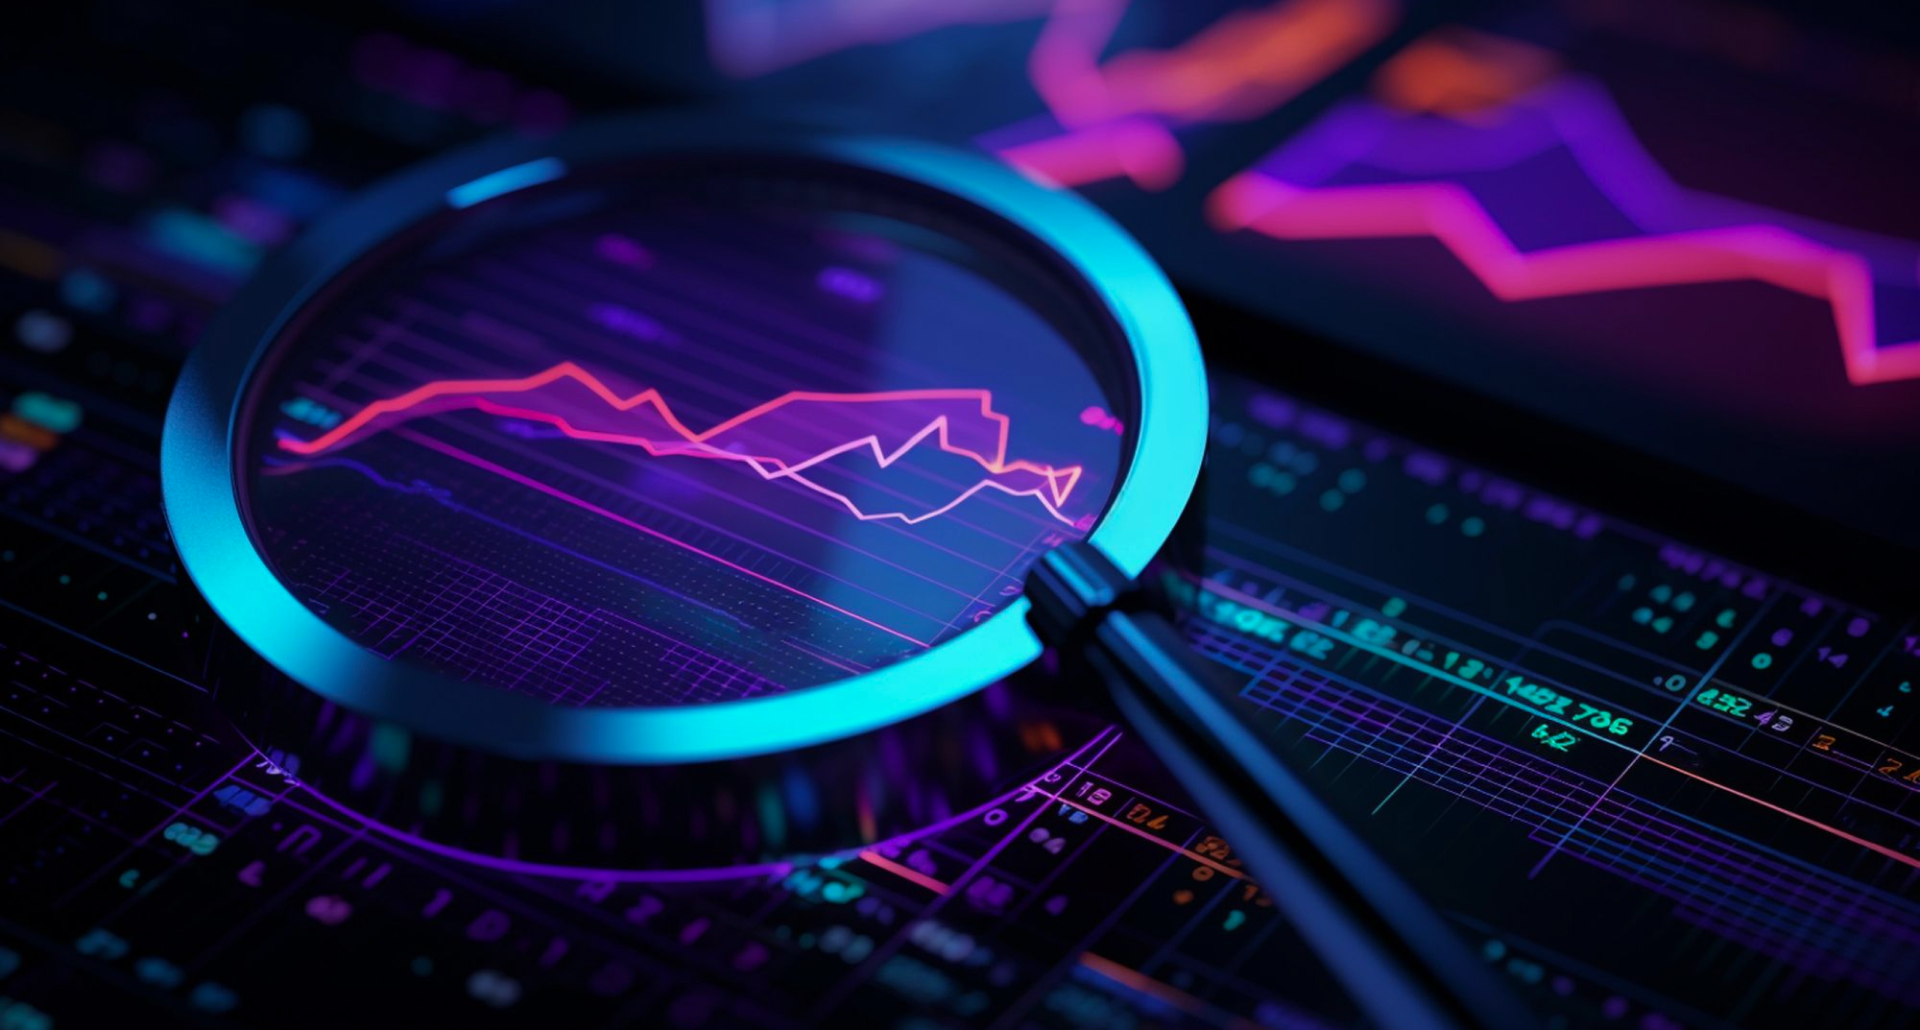
Breakout vs. Reversal Trading: Understanding the Best Entry Points
Welcome to the ever-thrilling world of price action—where candles break, trends twist, and the line between genius and a fakeout is razor thin.
If you’ve ever jumped into what you thought was a breakout only to have the price slap you with a reversal... yep, we’ve all been there.
But don’t stress—this isn’t about calling the market perfectly. It’s about recognising patterns, weighing the evidence, and entering with purpose. Let’s break it down.
The Two Doors You Can Enter Through
In trading, entries are everything. Most setups boil down to one of these two:
1. The Breakout Entry
A breakout happens when price pushes through a key level of support or resistance with conviction.
– Think: a stock breaks out above a horizontal resistance line.
– Why it matters: Breakouts often signal strong momentum. If confirmed, they can lead to significant moves.
– Classic example: Break above a triangle or consolidation zone.
2. The Reversal Entry
A reversal is when price changes direction entirely, usually after an extended trend.
– Think: market hits a new high but fails to continue and starts heading south.
– Why it matters: Reversals let you catch a trend early and ride it longer.
– Classic example: Double tops/bottoms, head and shoulders, trendline breaks.
So how do you know which one’s legit? That brings us to the trader’s toolkit.
Confirmation: Your Best Mate
Anyone can see a breakout—but experienced traders wait for confirmation. Here's what to watch for:
1. Volume
Volume is like applause—if the crowd’s quiet, maybe the move wasn’t that big of a deal.
A real breakout typically comes with a spike in volume, showing conviction.
2. Candlestick Clues
Look for a strong close beyond the breakout level. A tiny wicky candle barely peeking over resistance? That’s a “maybe”. A bullish engulfing candle with a big body? That’s a statement.
3. Retest Levels
Smart breakout traders love the retest. The market often returns to the broken level before continuing—think of it as a double-check. If the old resistance becomes new support (or vice versa), you’re likely onto something real.
Spotting a Fakeout (A.K.A. Your Trading Nemesis)
Ah, the fakeout. The trickster. The mirage in the desert.
Here’s how fakeouts usually work:
– Price briefly breaks the level
– Volume is low or inconsistent
– Candles reject the breakout with long wicks
– Price quickly returns to the range and traps breakout buyers
Pro tip: If it feels rushed, messy, or unsupported by volume—it probably is.
Reversal Setups: Reading the Market’s Mood Swings
When it comes to reversals, you’re looking for exhaustion. The trend is tired. The price is losing steam. Here’s what can tip you off:
– Divergence between price and momentum indicators like RSI or MACD
– Candlestick patterns: Pin bars, doji at the top of an uptrend? Could signal a turn.
– Key zones: Reversals often happen at major support/resistance levels—don’t ignore those big-picture price areas.
And remember: a reversal isn’t confirmed until the market breaks structure. Don’t guess. Let it show you.
Risk-Reward: The Real MVP
Whether you’re trading breakouts or reversals, your entry is only as good as your risk management.
– Breakouts: Ideal for momentum players. Stop loss just below the breakout level.
– Reversals: Reward-to-risk can be huge—but confirm structure first. Stops can be wider.
Golden Rule: Never enter without knowing where you’ll exit, both if you’re right and if you’re wrong.
Pull it All Together for Success: Know Yourself, Know the Setup
Some traders love the adrenaline of breakouts. Others wait patiently for the perfect reversal. Neither is better—what matters is knowing what you trade best.
Whichever style you gravitate toward, remember this: the market is full of opportunities, but the best traders don’t chase—they prepare.
At RCG Markets, we’re all about helping traders stay prepared and level-headed, whether you’re breakout hunting or waiting on that clean reversal. We’re here to equip—not overwhelm.
Now go read that chart with fresh eyes—and trade like you mean it.
 Markets